Vertex-wise statistics for FreeSurfer, in R
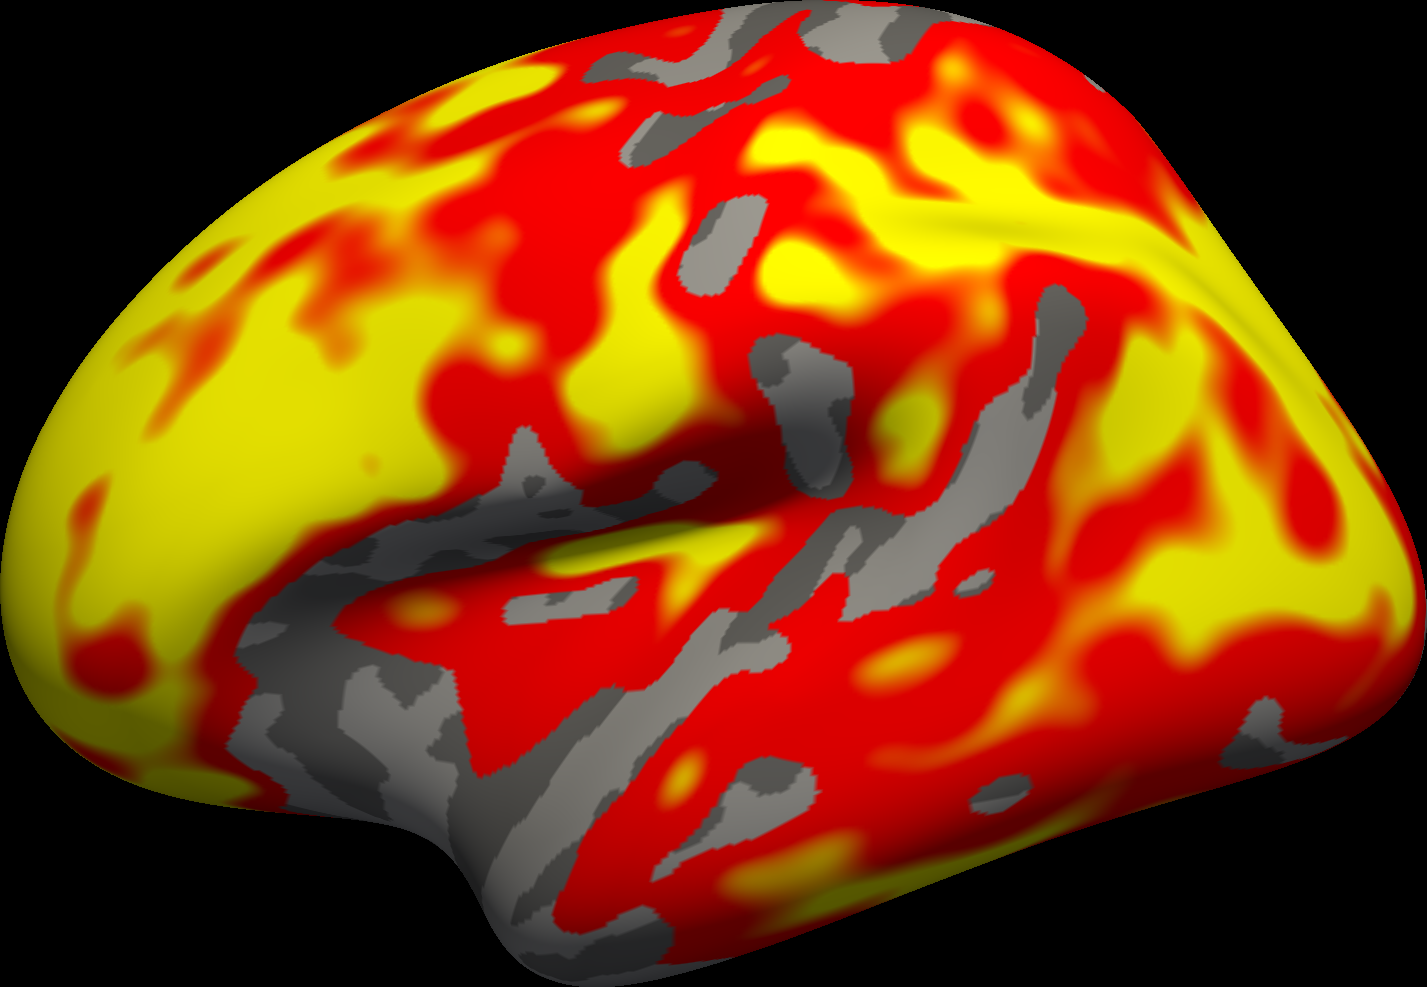
QDECR is an R package for vertex-wise statistical analysis of FreeSurfer surface data, with FreeSurfer's own correction for multiple testing.
For researchers who have run their scans through FreeSurfer and analyse their data in R: write the model as a formula, and get the significant clusters back.
Stable. Latest release 0.9.0. 0.10.0 in development.
Install and run
Install
In R, once FreeSurfer is set up.
install.packages("pak")
pak::pak("slamballais/QDECR")
library(QDECR)
Run
One hemisphere, with pheno a data frame of your subjects.
out <- qdecr_fastlm(qdecr_thickness ~ age + sex, data = pheno,
                    id = "id", hemi = "lh", project = "age_sex")
out
summary(out, annot = TRUE)
qdecr_snap(out, "age")
What it gives you
One analysis from the quick start: cortical thickness against age and sex in 99 typically developing participants of ABIDE I, run with QDECR 0.9.0 in 61 seconds a hemisphere on 4 cores.
| Hemisphere | Vertices | Area | Mean coefficient | Cluster-wise p | Peak |
|---|---|---|---|---|---|
| Left | 113,272 | 59,037 mm² | −0.029 mm a year | 0.0001 | inferiorparietal |
| Right | 117,846 | 61,169 mm² | −0.029 mm a year | 0.0001 | rostralmiddlefrontal |
summary() and FreeSurfer's cluster table. Inspecting results. Data: ABIDE I, preprocessed by the PCP, CC BY-NC-SA 3.0.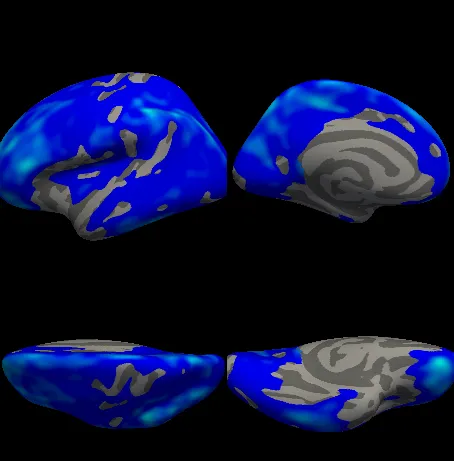
qdecr_snap(out, "age"): the age coefficient on its cluster, blue where the cortex is thinner with age. Plotting. Data: ABIDE I, preprocessed by the PCP, CC BY-NC-SA 3.0.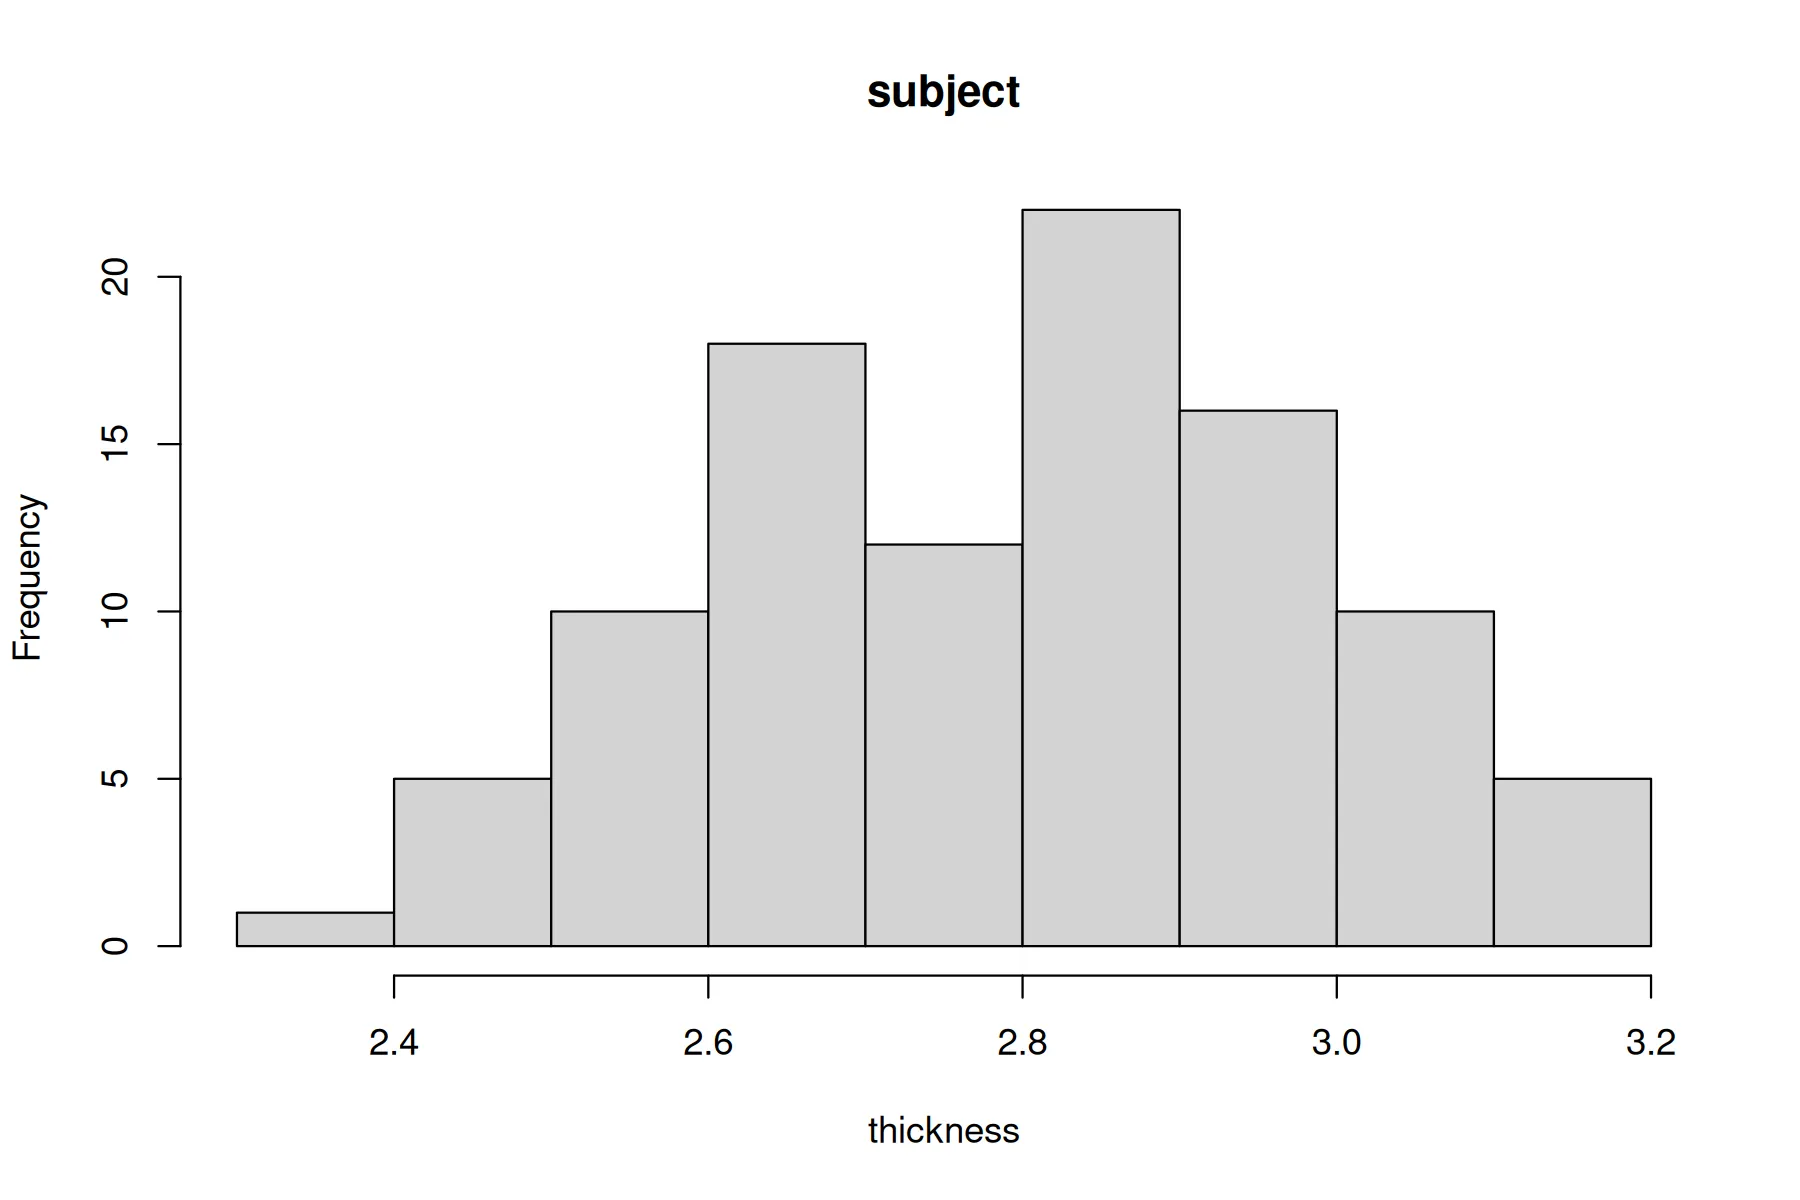
hist(out, qtype = "subject"): each subject's mean thickness, a first check for a failed surface. Histograms. Data: ABIDE I, preprocessed by the PCP, CC BY-NC-SA 3.0.What it does
R's formulas
Write the model as you would for lm(): factors, interactions, splines and transformations, fitted at every vertex.
FreeSurfer's correction
Clusters are tested against the Monte Carlo simulations FreeSurfer ships, the same correction mri_glmfit-sim applies.
Imputed data
Pass the datasets from mice, Amelia or mi as they are. QDECR fits every one and pools them with Rubin’s rules.
Weights
A weight per subject, as in lm(), for inverse probability weighting or any other weighted regression.
Any surface measure
Thickness, area, volume, curvature, gyrification, or a map of your own on the same surface.
Large samples
The vertex data live in files rather than memory, and the work spreads over as many cores as you give it.
Cite QDECR
If QDECR helped your research, please cite the paper that describes it:
Lamballais S, Muetzel RL. QDECR: A Flexible, Extensible Vertex-Wise Analysis Framework in R. Frontiers in Neuroinformatics. 2021;15:561689. doi:10.3389/fninf.2021.561689